Presentation for an algebra lesson (grade 7) on the topic: Linear equation with two variables and its graph. Lesson "linear equation with two variables and its graph"
Read also
As you know, there are equations containing two variables, for example, expressions of the form:
In addition to numerical values, such expressions contain two monomials involving unknown variables. In previous videos we have already looked at the properties of such expressions, as well as methods for finding roots.
Any equation with two variables has an answer in the form of a pair of numbers that are the values of x and y. Most often, there is an infinite set of answers, corresponding to two sets of numbers x and y. In addition, such equations may have only one root or no answer at all. But, in any case, if a certain value x is given, then if there is a real equality, a corresponding value y will be found. In other words, the answer to an equation in two variables is always a pair of numbers.
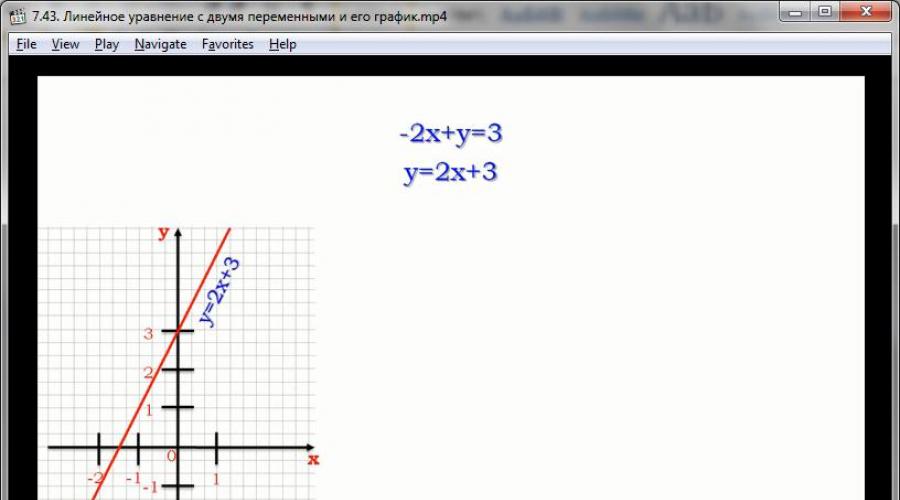
Equation of the form:
can be transformed identically, obtaining an equivalent expression:
y = 2.5 - 0.5x

By moving the terms so as to leave y on the left side, and x and all other monomials on the right, and also dividing both sides of the expression by 2, we obtain an equivalent equation. It is, in essence, some kind of relationship between the argument x and the value y. In this expression, this dependence is represented analytically linear form. But it can also be represented graphically by displaying a mathematical graph in a Cartesian coordinate system. For this, the argument values are calculated along the abscissa axis, and the function values are calculated along the ordinate axis.
In other words, in the case of equations with two variables, we can identically transform them to equivalent convenient formulas, and then use pairs of roots corresponding to the correct solution of this equation as coordinates of points in the Cartesian system. Several solutions to the equations will give several points connected into a single graph - a kind of curved line.
At the same time, the dependencies that can be traced between the variables in one equation are not always functions in the strict definition of this concept. For example, consider two equations:
At first glance, both equalities are quite similar. Let's build a dependence graph for each of them. As we can see in the video, the graphs of these expressions are quite different from each other. If for the equation y + x = 9 the graph is a straight line that does not pass through the coordinate center, then y 2 + x 2 = 9 has a graph in the form of a regular circle circumscribed with the center at the point (0, 0). If we try to use a graph to determine the value of y for a given x, we will see that each argument corresponds to two values of y. Any perpendicular drawn to the x-axis within the circle will necessarily intersect the circle at two points with the same argument, but with opposite y values. Mathematically this can be explained as follows:
x 2 + y 2 = a
y 2 = a - x 2

y = square root (a - x 2)
Any negative value cannot give square roots, and any positive always forms a pair of numbers as an answer, identical in value, but opposite in sign. In other words, each value of y with such a dependence will correspond to two arguments, which contradicts the basic principle of the function.
An expression of the form y + x = 9, however, is an ordinary linear function, since it fully meets its requirements. Any equations with two variables may or may not be functions.
Consider an abstract expression:
Any equality corresponding to this formula is called a linear equation with two variables. Its graph, in general, is a straight line, and its roots, as a rule, are a set of pairs x and y. Exceptions are possible when any coefficient - a, b, or free term c - is reset to zero. If b = 0, but if a is not equal to 0, then the answers to the equation will be a set of pairs of values in which x will always be equal to one number, and y will always be equal to any value. Indeed, in the equation:
x is always equal to 3, and y can be equal to any number, since this variable is still set to zero.
If a = 0, b = 0, but the free term is not equal to 0, then the equation does not have correct solutions, since in any case the principle of equality is violated. The graph of this equation will be the empty set. And finally, if all a, b, c = 0, then any combination of x and y is the right decision equations, and the graph covers the entire numerical set (the Cartesian network plane).
To consolidate the material, let's build a graph of the equation:

Let's transform the expression into a linear equation with two variables:
1/3(x) + 0y = 1
0y = 1 - 1/3(x)
The graph of this expression will be a straight line perpendicular to the x-axis at point (3, 0). For any y, the value of the argument is always 3.
Linear equation with two variables - any equation that has next view: a*x + b*y =с. Here x and y are two variables, a,b,c are some numbers.
The solution to the linear equation a*x + b*y = c is any pair of numbers (x,y) that satisfies this equation, that is, turns the equation with variables x and y into a correct numerical equality. A linear equation has an infinite number of solutions.
If each pair of numbers that are solutions to a linear equation in two variables is depicted on the coordinate plane as points, then all these points form the graph of a linear equation in two variables. The coordinates of the points will be our x and y values. In this case, the x value will be the abscissa, and the y value will be the ordinate.
Graph of a Linear Equation in Two Variables
The graph of a linear equation with two variables is the set of all possible points on the coordinate plane, the coordinates of which will be solutions to this linear equation. It is easy to guess that the graph will be a straight line. That is why such equations are called linear.
Construction algorithm
Algorithm for plotting a linear equation in two variables.
1. Draw coordinate axes, label them and mark the unit scale.
2. In a linear equation, put x = 0, and solve the resulting equation for y. Mark the resulting point on the graph.
3. In a linear equation, take the number 0 as y, and solve the resulting equation for x. Mark the resulting point on the graph
4. If necessary, take an arbitrary value of x and solve the resulting equation for y. Mark the resulting point on the graph.
5. Connect the resulting points and continue the graph beyond them. Sign the resulting straight line.
Example: Graph the equation 3*x - 2*y =6;
Let's put x=0, then - 2*y =6; y= -3;
Let's put y=0, then 3*x = 6; x=2;
We mark the obtained points on the graph, draw a straight line through them and label it. Look at the figure below, the graph should look exactly like this.
To use presentation previews, create an account for yourself ( account) Google and log in: https://accounts.google.com
Slide captions:
Linear function 7th grade algebra Lesson No. 6 -7. Coordinate plane. Linear equation with two variables and its graph 07/06/2012 1 www.konspekturoka.ru
Objectives: 07/06/2012 Recall the concept of a coordinate plane. Consider the image of a point on the coordinate plane. Give the concept of an equation with two variables, their solution and graph of the equation. Learn how to graph a linear equation with two variables. Learn the algorithm for plotting a linear equation with two variables. 2 www.konspekturoka.ru
O x y 1 Two mutually perpendicular numerical axes form a rectangular coordinate system 1 - 1 - 1 I II III I V Coordinate angles Ordinate (axis oh) Abscissa (axis oh) Let's remember! 07/06/2012 3 www.konspekturoka.ru
O x y 1 x = -3 Y = 3 x = -5 y = -2 X = 4 y = -5 x = 2 Y = 5 07/06/2012 www.konspekturoka.ru 4 Let's remember! Algorithm for finding the coordinates of the point M(a; b) Draw a straight line through the point, parallel to the y-axis, and find the coordinate of the point of intersection of this line with the x-axis - this will be the abscissa of the point. 2. Draw a line parallel to the x-axis through the point and find the coordinate of the point of intersection of this line with the y-axis - this will be the ordinate of the point. A B 5 2 C 4 -5 M -2 -5 3 -3 B(2;5); C(4;-5); M(-5;-2); A(-3;3)
A (-4; 6) B (5; -3) C (2; 0) D (0; -5) Remember! Algorithm for constructing point M(a; b) Construct a straight line x = a. Construct the straight line y = b. Find the point of intersection of the constructed lines - this will be the point M(a; b) 6 -4 5 -3 -5 2 07/06/2012 5 www.konspekturoka.ru
07/06/2012 www.konspekturoka.ru 6 An equation of the form: a x + b = 0 is called a linear equation with one variable (where x is a variable, a and b are some numbers). Attention! x – the variable enters the equation necessarily in the first degree. (45 - y) + 18 = 58 linear equation with one variable 3x² + 6x + 7 = 0 non-linear equation with one variable Let's remember!
ax + by + c = 0 Linear equation with two variables 07/06/2012 7 www.konspekturoka.ru The solution to an equation with two unknowns is a pair of variables, upon substitution of which the equation becomes a true numerical equality. An equation of the form: is called a linear equation with two variables (where x, y are variables, a, b and c are some numbers). (x;y)
07/06/2012 www.konspekturoka.ru 8 Solving a linear equation with one variable means finding those values of the variable for each of which the equation turns into a correct numerical equality. (x; y)- ? There are infinitely many such solutions.
07/06/2012 www.konspekturoka.ru 9 A linear equation with two variables has properties like equations with one variable. If in an equation we move a term from one part to another, changing its sign, we get an equivalent equation. 2. If both sides of the equation are multiplied or divided by a number (not equal to zero), you get an equivalent equation.
07/06/2012 www.konspekturoka.ru 10 Equivalent equations Since the term 4y³ is transferred from the left side to the right, equations with two variables having the same roots are called equivalent.
07/06/2012 www.konspekturoka.ru 11 O x y 1 Example 1 Draw solutions to a linear equation with two variables x + y – 3 = 0 points in the coordinate plane. 1. Let's select several pairs of numbers that satisfy the equation: (3; 0), (2; 1), (1; 2), (0; 3), (-2; 5). 2. Construct points at xOy: A(3; 0), B(2; 1), C(1; 2), E(0; 3), M(-2; 5). 3 E(0; 3) 1 2 C(1; 2) 1 2 B(2; 1) 3 A(3; 0) -2 5 M(-2; 5) 3. Connect all the dots. Attention! All points lie on the same straight line. In the future: to construct a straight line, 2 points are enough m m - graph of the equation x + y - 3 = 0 They say: m - geometric model of the equation x + y - 3 = 0 -4 7 P(-4; 7) P(-4; 7 ) is a pair that belongs to the line and is a solution to the equation
07/06/2012 www.konspekturoka.ru 12 Conclusion: If (-4; 7) is a pair of numbers that satisfies the equation, then the point P(-4; 7) belongs to the straight line t. If the point P(-4; 7) belongs to the straight line t , then pair(-4;7) is the solution to the equation. Vice versa:
07/06/2012 www.konspekturoka.ru 13 Theorem: The graph of any linear equation ax + by + c = 0 is a straight line. To construct a graph, it is enough to find the coordinates of two points. Real situation (verbal model) Algebraic model Geometric model The sum of two numbers is 3. x + y = 3 (linear equation with two variables) line t (graph of a linear equation with two variables) x + y – 3 = 0
07/06/2012 www.konspekturoka.ru 14 x y 1 Example 2 Construct a graph of the equation 3 x - 2y + 6 = 0 1. Let x = 0, substitute into the equation 3· 0 - 2y + 6 = 0 - 2y + 6 = 0 - 2y = - 6 y = - 6: (-2) y = 3 (0;3) - a pair of numbers, there is a solution to 2. Let y = 0, substitute 3 x - 2 0 + 6 = 0 3x + into the equation 6 = 0 3x = - 6 x = - 6: 3 x = - 2 (-2;0) - a pair of numbers, there is solution 3. Construct the points and connect with a straight line 0 3 -2 3 x - 2y + 6 = 0
07/06/2012 www.konspekturoka.ru 15 Algorithm for constructing a graph of the equation ax + b y + c = 0 Give the variable x a specific value x ₁; find from the equation ax + b y + c = 0 the corresponding value of y ₁. We get (x₁;y₁). 2. Give the variable x a specific value x ₂; find from the equation ax + b y + c = 0 the corresponding value of y ₂. We get (x ₂;y ₂). 3. Construct points (x₁; y₁), (x₂; y₂) on the coordinate plane and connect them with a straight line. 4. Straight line - there is a graph of the equation.
07/06/2012 16 www.konspekturoka.ru Answer the questions: What is called the coordinate plane? What is the algorithm for finding the coordinates of a point on the coordinate plane? What is the algorithm for constructing a point on a coordinate plane? Formulate the basic properties of the equations. What equations are called equivalent? What is the solution to a linear equation in two variables? 7. What is the algorithm for graphing a linear equation in two variables?
We have often come across equations of the form ax + b = 0, where a, b are numbers, x is a variable. For example, bx - 8 = 0, x + 4 = O, - 7x - 11 = 0, etc. The numbers a, b (equation coefficients) can be any, except for the case when a = 0.
The equation ax + b = 0, where a, is called a linear equation with one variable x (or a linear equation with one unknown x). We can solve it, that is, express x through a and b:
We noted earlier that quite often mathematical model the real situation is a linear equation with one variable or an equation that, after transformations, reduces to a linear one. Now let's look at this real situation.
From cities A and B, the distance between which is 500 km, two trains left towards each other, each with its own constant speed. It is known that the first train left 2 hours earlier than the second. 3 hours after the second train left, they met. What are the train speeds?
Let's create a mathematical model of the problem. Let x km/h be the speed of the first train, y km/h be the speed of the second train. The first one was on the road for 5 hours and, therefore, covered a distance of bx km. The second train was on the way for 3 hours, i.e. walked a distance of 3 km.
Their meeting took place at point C. Figure 31 shows a geometric model of the situation. In algebraic language it can be described as follows:
5x + Zu = 500

or
5x + Zu - 500 = 0.
This mathematical model is called a linear equation with two variables x, y.
At all,
ax + by + c = 0,
where a, b, c are numbers, and , is linear the equation with two variables x and y (or with two unknowns x and y).
Let's return to the equation 5x + 3 = 500. We note that if x = 40, y = 100, then 5 40 + 3 100 = 500 is a correct equality. This means that the answer to the question of the problem can be as follows: the speed of the first train is 40 km/h, the speed of the second train is 100 km/h. A pair of numbers x = 40, y = 100 is called a solution to the equation 5x + 3 = 500. It is also said that this pair of values (x; y) satisfies the equation 5x + 3 = 500.
Unfortunately, this solution is not the only one (we all love certainty and unambiguity). In fact, the following option is also possible: x = 64, y = 60; indeed, 5 64 + 3 60 = 500 is a correct equality. And this: x = 70, y = 50 (since 5 70 + 3 50 = 500 is a true equality).
But, say, a pair of numbers x = 80, y = 60 is not a solution to the equation, since with these values a true equality does not work:
In general, a solution to the equation ax + by + c = 0 is any pair of numbers (x; y) that satisfies this equation, that is, turns the equality with the variables ax + by + c = 0 into a true numerical equality. There are infinitely many such solutions.
Comment. Let us return once again to the equation 5x + 3 = 500, obtained in the problem discussed above. Among infinite number its solutions are, for example, the following: x = 100, y = 0 (indeed, 5 100 + 3 0 = 500 is the correct numerical equality); x = 118, y = - 30 (since 5,118 + 3 (-30) = 500 is a correct numerical equality). However, being solutions to the equation, these pairs cannot serve as solutions to this problem, because the speed of the train cannot be equal to zero (then it does not move, but stands still); Moreover, the speed of the train cannot be negative (then it does not travel towards another train, as stated in the problem statement, but in the opposite direction).
Example 1. Draw solutions to a linear equation with two variables x + y - 3 = 0 by points in the xOy coordinate plane.
Solution. Let's select several solutions given equation, i.e. several pairs of numbers that satisfy the equation: (3; 0), (2; 1), (1; 2) (0; 3), (- 2; 5).
A. V. Pogorelov, Geometry for grades 7-11, Textbook for educational institutions
Lesson content lesson notes support frame lesson presentation acceleration methods interactive technologies Practice tasks and exercises self-test workshops, trainings, cases, quests homework discussion questions rhetorical questions from students Illustrations audio, video clips and multimedia photographs, pictures, graphics, tables, diagrams, humor, anecdotes, jokes, comics, parables, sayings, crosswords, quotes Add-ons abstracts articles tricks for the curious cribs textbooks basic and additional dictionary of terms other Improving textbooks and lessonscorrecting errors in the textbook updating a fragment in a textbook, elements of innovation in the lesson, replacing outdated knowledge with new ones Only for teachers perfect lessons calendar plan for a year guidelines discussion programs Integrated Lessons"Linear equation in two variables and its graph."
Lesson Objectives:
to develop in students the ability to construct graphs of a linear equation with two variables, to solve problems using two variables when drawing up a mathematical model;
develop students' cognitive skills, critical and creative thinking; upbringing cognitive interest to mathematics, perseverance, dedication in learning.
Tasks:
introduce the concept of a linear equation as a mathematical model of a real situation;
teach how to determine a linear equation and its coefficients by type;
teach using a given value x to find the corresponding value y, and vice versa;
introduce an algorithm for constructing a graph of a linear equation and teach how to apply it in practice;
teach how to compose a linear equation as a mathematical model of a problem.
In addition to ICT technologies, the lesson uses problem-based learning, elements of developmental training, group interaction technology.
Lesson type: lesson in developing skills and abilities.
I. Organizational stage. Slide 1.
Checking students' readiness for the lesson, communicating the lesson topic, goals and objectives.
II. Oral work.
1. Slide 2. From the proposed equations, select a linear equation with two variables:
A) 3x – y = 14
B) 5y + x² = 16
B) 7xy – 5y = 12
D) 5x + 2y = 16
Answer: a, d.
Additional question: Which equation with two variables is called linear? Slide 3.
Answer: ah + wu + c = 0.
Slide 4. Working on the concept of a linear equation using examples (oral work).
Slide 5-6. Name the coefficients of a linear equation.
2. Slide 7. Select a point that belongs to the graph of the equation 2x + 5y = 12
A(-1; -2), B(2; 1), C(4; -4), D (11; -2).
Answer: D (11; -2).
Bonus Question: What is the graph of an equation in two variables? Slide 8.
Answer: direct.
3. Slide 9. Find the abscissa of the point M(x; -2) belonging to the graph of the equation 12x – 9y = 30.
Answer: x = 1.
Additional question: What is called solving an equation in two variables? Slide 10.
Answer: A solution to an equation with two variables is a pair of values of the variables that turns the equation into a true equality.
4.Slide 11.
1. In what picture is the graph linear function positive slope
2. In which picture does the graph of a linear function have a negative slope?
3. Which function graph have we not studied?
5. Slide 12. Name the numerical interval corresponding to the geometric model:
A). (-6; 8) B). (-6; 8] V).[- 6; 8) G).[-6;8]
X
-6 8
III. Setting the lesson goal.
Today in the lesson we will consolidate the ability to build graphs of a linear equation with two variables, solve problems using two variables when drawing up a mathematical model (the need to draw up a linear equation to solve a problem with two unknowns).
Try to be persistent and purposeful when completing tasks.
IV. Consolidation. Slide 13.
Task. From cities A and B, the distance between which is 500 km, two trains departed towards each other, each with its own constant speed. It is known that the first train left 2 hours earlier than the second. 3 hours after the second train left, they met. What are the train speeds?Create a mathematical model for the problem and find two solutions.
Slide 14. (Drawing up a mathematical model for the problem). Demonstration of compiling a mathematical model .
What is the solution to a linear equation in two variables?
The teacher asks the question: how many solutions does a linear equation with two variables have? Answer: infinitely many.
Teacher: how can you find solutions to a linear equation with two variables? Answer: pick.
Teacher: what is the easiest way to find solutions to the equation?
Answer: select one variable, for example x, and find another from the equation - y.
Slide 15.
- Check whether the following pairs of values solve the equation.
Task.
Slide 16.
Two tractor drivers plowed 678 hectares together. The first tractor driver worked for 8 days, and the second for 11 days. How many hectares did each tractor driver plow per day? Write a linear equation with two variables for the problem and find 2 solutions.
Slide 17-18.
What is called the graph of an equation in two variables? Consider different cases.
Slad 19. Algorithm for plotting a linear function.
Slide 20. (oral) Consider an example of plotting a linear equation with two variables.
V. Work according to the textbook.
Slide 21. Graph the equation:
page 269
I option No. 1206 (b)
II option No. 1206 (c)
VI. Independent work. Slide 22.
Option 1.
1. Which of the pairs of numbers (1;1), (6;5), (9;11) are the solution to the equation 5x – 4y - 1 =0?
2. Graph the function 2x + y = 4.
Option 2.
Which of the pairs of numbers (1;1), (1;2), (3;7) are the solution to the equation 7x – 3y - 1 =0?
Graph the function 5x + y – 4 = 0.
(Followed by check, check Slide 23-25)
VII. Consolidation. Slide 26.
Build it right.(Assignment for all students in the class). Construct the flower in question using lines:
About 120 species of these flowers are known, distributed mainly in Central, Eastern and Southern Asia and Southern Europe.
Botanists believe that this culture originated in Turkey in the 12th century. The plant gained world fame far from its homeland, in Holland, rightly called the Country of these flowers.
Motifs of these colors are often found on various artistically designed products (and jewelry).
Here is the legend about this flower.
In a golden bud yellow flower happiness was contained. No one could reach this happiness, because there was no such force that could open its bud.
But one day a woman with a child was walking through the meadow. The boy escaped from his mother’s arms, ran up to the flower with a ringing laugh, and the golden bud opened. The carefree children's laughter accomplished what no force could do. Since then, it has become a custom to give these flowers only to those who feel happiness.
It is necessary to construct graphs of functions and select that part of it for the points of which the corresponding inequality holds:
y = x + 6,
4 < X < 6;
y = -x + 6,
6 < X < -4;
y = - 1/3 x + 10,
6 < X < -3;
y = 1/3 x +10,
3 < X < 6;
y = -x + 14,
0 < X < 3;
y = x + 14,
3 < X < 0;
y = 5 x – 10,
2 < X < 4;
y = - 5 x – 10,
4 < X < -2;
y = 0,
2 < X < 2.
We got a drawing - TULIP. Slide 27.

VIII. Reflection. Slide 28.
IX. Homework. Slide 29.
P.43, No. 1206 (g-f), 1208 (g-f), 1214