ASTM D5307, D7169 (crude oil) and D2887 (diesel fuels, gas oils, lubricants, base oils). Determination of fractional composition using simulated distillation method
|
The simulated distillation method is a gas chromatography technique designed to simulate the actual distillation process of crude oil and petroleum products. This method includes not only equipment (Clarus gas chromatograph), but also software (Simulated Distillation Software (Model 3022)). By using software The chromatogram of a hydrocarbon sample is divided into homogeneous sections. Boiling points are associated with retention times using a calibration standard. Based on these data, a boiling curve V,% - T, o C can be obtained and a report can be generated. This method allows you to obtain data equivalent to the results of distillation according to ASTM D 2892 (15 theoretical plates) and GOST 11011 (fractional composition on ARN-2), while allowing you to significantly save on analysis time, work with small volumes of sample, and also use a smaller size equipment. The simulated distillation method can also be used to determine the fractional composition of gasolines ( ASTMD 3710 ) and oil fractions with boiling points of 174...700 o C ( ASTMD6352 ). |
E70-24944
GAS CHROMATOGRAPHER CLARUS - ANALYZER 3023
CONTENTS OF DELIVERY:
ARNEL PE analyzer with autosampler, FID detector, injector and instrument control software
Autonomous thermostat cooling system that does not require the use of liquid carbon dioxide and LN2
SIMDIST software for calculating simulated distillation results
Capillary column (depending on configuration)
Equipment for supplying the chromatograph with gas
Other components and consumables
HYDROGEN GENERATOR 20H:
SPECIFICATIONS
MINIMUM ORDER SET
PE analyzer ARNEL Model 3023
OPTIONAL EQUIPMENT
Septa for THERMOGREEN LB-2 injector (50 pcs.)
Syringe for introducing sample into the injector
Replacement needle for syringes
Capillary column
Starter kit for capillary injector
Detector connection kit
Autodispenser starter kit
Carrier gas purification system. (three cartridges: purification from moisture, hydrocarbons and oxygen)
A set of spare cartridges for the cleaning system
Filter drier
High purity helium reducer
Workstation (computer, monitor and printer)
Low noise oil-free compressor for chromatography (54 l/min 8 bar)
Simulated distillation
Also for the analysis of petroleum products, the widely used gas chromatographic method of simulated distillation is used. The traditional simulated distillation method involves the use of packed columns. The jet fuel and diesel fuel specifications indicate simulated distillation as an alternative to distillation in atmospheric pressure when obtaining information about the true distribution of boiling points. The simulated distillation method uses gas chromatographic techniques to obtain information about the true distribution of boiling points of oil and oil fractions up to 750 °C.
Using the method of simulated distillation, a curve of true boiling points is obtained, which is constructed according to the data of the chromatographic separation of the product under study on a column with a non-polar sorbent in temperature programming mode. After introducing the sample into the injector, hydrocarbon groups are displayed on the chromatogram in order of increasing boiling points. The system is first calibrated using a standard mixture of hydrocarbons with known boiling points. The simulated distillation curves coincide well with the results of determining the fractional composition by distillation at atmospheric pressure and at reduced pressure. To describe heavy oil fractions, a gas chromatograph with a high-temperature thermostat was used.
The simulated distillation method using gas chromatography makes it possible to analyze petroleum products not only faster and with a greater degree of accuracy, but also requires fewer quantities of analyzed substances.
Atomic absorption analysis
The analysis of petroleum products occupies one of the main segments of the application of atomic absorption in the analysis of substances. Typical samples of petroleum products are crude oil, fuel (gasoline) and lubricating oils (freshly prepared and used).
Atomic absorption analysis (atomic absorption spectrometry), a method of quantitative elemental analysis based on atomic absorption (absorption) spectra. Radiation in the range of 190–850 nm is passed through a layer of atomic vapors of samples obtained using an atomizer. As a result of the absorption of light quanta, atoms transform into excited energy states. These transitions in atomic spectra correspond to the so-called resonance lines characteristic of of this element. According to the Bouguer–Lambert–Beer law, the measure of element concentration is the optical density A = log(I0/I), where I0 and I are the radiation intensities from the source, respectively, before and after passing through the absorbing layer.
Picture 1: Schematic diagram flame atomic absorption spectrometer: 1-radiation source; 2-flame; 3-monochrome of mountains; 4-photomultiplier; 5-recording or indicating device.
Instruments for atomic absorption analysis - atomic absorption spectrometers - are precision, highly automated devices that ensure reproducibility of measurement conditions, automatic introduction of samples and recording of measurement results. Some models have built-in microcomputers. As an example, the figure shows a diagram of one of the spectrometers. The source of line radiation in spectrometers is most often single-element lamps with a hollow cathode filled with neon. To determine some highly volatile elements (Cd, Zn, Se, Te, etc.), it is more convenient to use high-frequency electrodeless lamps.
The transfer of the analyzed object into an atomized state and the formation of an absorbing layer of vapor of a certain and reproducible shape is carried out in an atomizer - usually in a flame or a tubular furnace. Naib. flames of mixtures of acetylene with air (max. temperature 2000 °C) and acetylene with N2O (2700 °C) are often used. A burner with a slot-like nozzle 50–100 mm long and 0.5–0.8 mm wide is installed along the optical axis of the device to increase the length of the absorbing layer.
Tubular resistance furnaces are most often made from dense grades of graphite. To eliminate vapor diffusion through the walls and increase durability, graphite tubes are coated with a layer of gas-tight pyrolytic carbon. The maximum heating temperature reaches 3000 °C. Less common are thin-walled tubular furnaces made of refractory metals (W, Ta, Mo), quartz with a nichrome heater. To protect graphite and metal furnaces to prevent burning in air, they are placed in semi-hermetic or sealed chambers through which inert gas (Ar, N2) is blown. The introduction of samples into the absorption zone of a flame or furnace is carried out using different techniques. Solutions are sprayed (usually into a flame) using pneumatic sprayers, less often ultrasonic sprayers. The former are simpler and more stable in operation, although they are inferior to the latter in the degree of dispersion of the resulting aerosol. Only 5–15% of the smallest aerosol droplets enter the flame, and the rest is screened out in the mixing chamber and discharged into the drain. The maximum concentration of solids in solution usually does not exceed 1%. Otherwise, intense deposition of salts occurs in the burner nozzle.
Thermal evaporation of dry solution residues is the main method of introducing samples into tube furnaces. In this case, samples are most often evaporated from the inner surface of the furnace; the sample solution (volume 5–50 μl) is injected using a micropipette through the dosing hole in the wall of the tube and dried at 100 °C. However, samples evaporate from the walls with a continuous increase in the temperature of the absorbing layer, which causes instability of the results. To ensure a constant oven temperature at the time of evaporation, the sample is introduced into a preheated oven using a carbon electrode (graphite cell), graphite crucible (Woodriff oven), metal or graphite probe. The sample can be evaporated from a platform (graphite trough), which is installed in the center of the furnace under the dosing hole. As a result of a significant lag between the temperature of the platform and the temperature of the furnace, which is heated at a rate of about 2000 K/s, evaporation occurs when the furnace reaches an almost constant temperature.
To be introduced into the flame solids or dry residues of solutions, rods, threads, boats, crucibles made of graphite or refractory metals are used, placed below the optical axis of the device, so that the sample vapors enter the absorption zone with the flow of flame gases. In some cases, graphite evaporators are additionally heated electric shock. To eliminate mechanical losses of powdered samples during the heating process, cylindrical capsule-type evaporators made of porous graphite are used.
Sometimes sample solutions are processed in a reaction vessel in the presence of reducing agents, most often NaBH4. In this case, Hg, for example, is distilled off in elemental form, As, Sb, Bi and others in the form of hydrides, which are introduced into the atomizer by flow inert gas. To monochromatize radiation, prisms or diffraction gratings are used; in this case, a resolution of 0.04 to 0.4 nm is achieved.
In newly discovered oil fields, it is necessary to very carefully study the composition and impurity content of the extracted oil. Depending on the location of oil production, their composition can vary significantly. This is especially true for sulfur, hydrogen sulfide and methyl ethyl mercaptans. Moreover, the content can vary widely: from 0.60 to 5.00%. So, for example, there are low-sulfur ones: the sulfur content in them is up to 0.60%, sulfurous - from 0.61 to 1.80%, high-sulfur - from 1.81 to 3.50%, especially high-sulfur - over 3.50% GOST 1437 and 9.2.
Recently, laboratories have begun to use more advanced methods for determining sulfur instead of labor-intensive methods for determining sulfur.
Energy-dispersive X-ray fluorescence spectroscopy
Thus, to determine sulfur it is used modern method energy-dispersive X-ray fluorescence spectroscopy according to GOST 51947-2002. Its essence lies in the fact that oil is placed in a beam of rays emitted by an X-ray source. The characteristics of the excitation energy from X-ray radiation are measured and the resulting pulse counter signal is compared with the counter signals obtained from previously prepared calibration samples. This method provides a fast and accurate measurement of total sulfur in oil with minimal sample preparation. Analysis time is usually 2-4 minutes. Sulfur measurement range from 0.0150 to 5.00%. The X-ray fluorescence spectrometer is characterized by the speed of obtaining results, convenience, and good accuracy. There are many methods for conducting research in various areas science and technology
Simulated distillation
Also for the analysis of petroleum products, the widely used gas chromatographic method of simulated distillation is used. The traditional simulated distillation method involves the use of packed columns. The jet fuel and diesel fuel specifications specify simulated distillation as an alternative to atmospheric distillation when obtaining true boiling point distribution information. The simulated distillation method uses gas chromatographic techniques to obtain information about the true distribution of boiling points of oil and oil fractions up to 750 °C.
Using the method of simulated distillation, a curve of true boiling points is obtained, which is constructed according to the data of the chromatographic separation of the product under study on a column with a non-polar sorbent in temperature programming mode. After introducing the sample into the injector, hydrocarbon groups are displayed on the chromatogram in order of increasing boiling points. The system is first calibrated using a standard mixture of hydrocarbons with known boiling points. The simulated distillation curves coincide well with the results of determining the fractional composition by distillation at atmospheric pressure and at reduced pressure. To describe heavy oil fractions, a gas chromatograph with a high-temperature thermostat was used.
The simulated distillation method using gas chromatography makes it possible to analyze petroleum products not only faster and with a greater degree of accuracy, but also requires fewer quantities of analyzed substances.
Atomic absorption analysis
The analysis of petroleum products occupies one of the main segments of the application of atomic absorption in the analysis of substances. Typical samples of petroleum products are crude oil, fuel (gasoline) and lubricating oils (freshly prepared and used).
Atomic absorption analysis (atomic absorption spectrometry), a method of quantitative elemental analysis based on atomic absorption (absorption) spectra. Radiation in the range of 190-850 nm is passed through a layer of atomic vapors of samples obtained using an atomizer. As a result of the absorption of light quanta, atoms transform into excited energy states. These transitions in atomic spectra correspond to the so-called resonance lines characteristic of a given element. According to the Bouguer-Lambert-Beer law, the measure of element concentration is the optical density A = log(I 0 /I), where I 0 and I are the radiation intensities from the source, respectively, before and after passing through the absorbing layer.
Figure 1: Schematic diagram of a flame atomic absorption spectrometer: 1-radiation source; 2-flame; 3-monochrome of mountains; 4-photomultiplier; 5-recording or indicating device.
Instruments for atomic absorption analysis - atomic absorption spectrometers - are precision, highly automated devices that ensure reproducibility of measurement conditions, automatic introduction of samples and recording of measurement results. Some models have built-in microcomputers. As an example, the figure shows a diagram of one of the spectrometers. The source of line radiation in spectrometers is most often single-element lamps with a hollow cathode filled with neon. To determine some highly volatile elements (Cd, Zn, Se, Te, etc.), it is more convenient to use high-frequency electrodeless lamps.
The transfer of the analyzed object into an atomized state and the formation of an absorbing layer of vapor of a certain and reproducible shape is carried out in an atomizer - usually in a flame or tubular furnace. Naib. flames of mixtures of acetylene with air (max. temperature 2000 °C) and acetylene with N2O (2700 °C) are often used. A burner with a slot-like nozzle 50-100 mm long and 0.5-0.8 mm wide is installed along the optical axis of the device to increase the length of the absorbing layer.
Tubular resistance furnaces are most often made from dense grades of graphite. To eliminate vapor diffusion through the walls and increase durability, graphite tubes are coated with a layer of gas-tight pyrolytic carbon. The maximum heating temperature reaches 3000 °C. Less common are thin-walled tubular furnaces made of refractory metals (W, Ta, Mo), quartz with a nichrome heater. To protect graphite and metal furnaces from burning in air, they are placed in semi-hermetic or sealed chambers through which inert gas (Ar, N2) is blown. The introduction of samples into the absorption zone of a flame or furnace is carried out using different techniques. Solutions are sprayed (usually into a flame) using pneumatic sprayers, less often - ultrasonic sprayers. The former are simpler and more stable in operation, although they are inferior to the latter in the degree of dispersion of the resulting aerosol. Only 5-15% of the smallest aerosol droplets enter the flame, and the rest is screened out in the mixing chamber and discharged into the drain. The maximum concentration of solids in solution usually does not exceed 1%. Otherwise, intense deposition of salts occurs in the burner nozzle.
Thermal evaporation of dry solution residues is the main method of introducing samples into tube furnaces. In this case, samples are most often evaporated from the inner surface of the furnace; the sample solution (5-50 µl volume) is injected using a micropipette through the dosing hole in the tube wall and dried at 100 °C. However, samples evaporate from the walls with a continuous increase in the temperature of the absorbing layer, which causes instability of the results. To ensure a constant oven temperature at the time of evaporation, the sample is introduced into a preheated oven using a carbon electrode (graphite cell), graphite crucible (Woodriff oven), metal or graphite probe. The sample can be evaporated from a platform (graphite trough), which is installed in the center ovens under the dosing hole. As a result of a significant lag between the temperature of the platform and the temperature of the furnace, which is heated at a rate of about 2000 K/s, evaporation occurs when the furnace reaches an almost constant temperature.
To introduce solid substances or dry residues of solutions into the flame, rods, threads, boats, crucibles made of graphite or refractory metals are used, placed below the optical axis of the device, so that the sample vapor enters the absorption zone with the flow of flame gases. In some cases, graphite evaporators are additionally heated by electric current. To eliminate mechanical losses of powdered samples during the heating process, cylindrical capsule-type evaporators made of porous graphite are used.
Sometimes sample solutions are processed in a reaction vessel in the presence of reducing agents, most often NaBH4. In this case, Hg, for example, is distilled off in elemental form, As, Sb, Bi and others in the form of hydrides, which are introduced into the atomizer with a flow of inert gas. To monochromatize radiation, prisms or diffraction gratings are used; in this case, a resolution of 0.04 to 0.4 nm is achieved.
In atomic absorption analysis, it is necessary to exclude the overlap of the radiation of the atomizer with the radiation of the light source, to take into account a possible change in the brightness of the latter, spectral interference in the atomizer caused by partial scattering and absorption of light by solid particles and molecules of foreign components of the sample. To do this, use various techniques, for example. they modulate the radiation of the source with a frequency to which the receiving and recording device is tuned; they use a two-beam scheme or an optical scheme with two light sources (with discrete and continuous spectra). The most effective scheme is based on Zeeman splitting and polarization of spectral lines in an atomizer. In this case, light polarized perpendicular to the magnetic field is passed through the absorbing layer, which makes it possible to take into account non-selective spectral interference reaching values of A = 2 when measuring signals that are hundreds of times weaker.
The advantages of atomic absorption analysis are simplicity, high selectivity and little influence of the sample composition on the analysis results. Limitations of the method are the impossibility of simultaneous determination of several elements when using linear radiation sources and, as a rule, the need to transfer samples into solution.
Atomic absorption analysis is used to determine about 70 elements. Gases and some other nonmetals whose resonance lines lie in the vacuum region of the spectrum (wavelength less than 190 nm) are also not detected. Using a graphite furnace, it is impossible to determine Hf, Nb, Ta, W and Zr, which form low-volatile carbides with carbon. The detection limits of most elements in solutions during atomization in a flame are 1-100 μg/l, in a graphite furnace they are 100-1000 times lower. The absolute detection limits in the latter case are 0.1-100 pg. Relative standard deviation in optimal conditions measurements reach 0.2-0.5% for a flame and 0.5-1.0% for a furnace. In automatic mode, the flame spectrometer can analyze up to 500 samples per hour, and the spectrometer with a graphite furnace can analyze up to 30 samples. Both options are often used in combination with preliminary separation and concentration by extraction, distillation, ion exchange, and chromatography, which in some cases makes it possible to indirectly determine some nonmetals and organic compounds.
Methods of atomic absorption analysis are also used to measure some physical and physicochemical quantities - the diffusion coefficient of atoms in gases, temperatures of the gaseous medium, heats of evaporation of elements and others; to study the spectra of molecules, study processes associated with the evaporation and dissociation of compounds.
The determination of metal and phosphorus impurities in petroleum products is carried out using the flame atomic absorption method or using inductively coupled plasma optical emission spectrometers. The main problem when working with samples of this type is the need for their preparation. This is usually done by ashing the matrix and dissolving the resulting residue in a water-acid mixture.
Infrared spectroscopy
Infrared spectroscopy (IR spectroscopy), a branch of molecular optical spectroscopy that studies absorption and reflection spectra electromagnetic radiation in the IR region, that is, in the wavelength range from 10-6 to 10-3 m. In the coordinates, the intensity of absorbed radiation is the wavelength (or wave number). The IR spectrum is a complex curve with a large number of maxima and minima. Absorption bands appear as a result of transitions between vibrational levels of the ground electronic state of the system being studied. Spectral characteristics (positions of band maxima, their half-width, intensity) of an individual molecule depend on the masses of its constituent atoms, geometric structure, features of interatomic forces, charge distribution, etc. Therefore, IR spectra are highly individual, which determines their value in identifying and studying the structure connections. To record spectra, classical spectrophotometers and Fourier spectrometers are used.
Infrared absorption, reflection or scattering spectra provide extremely rich information about the composition and properties of a sample. By comparing the IR spectrum of a sample with the spectra of known substances, it is possible to identify an unknown substance and determine the main composition food products, polymers, detect impurities in atmospheric air and gases, conduct fractional or structural group analysis. Method correlation analysis Using the IR spectrum of a sample, it is also possible to determine its physicochemical or biological characteristics, for example, seed germination, calorie content of food products, granule size, density, etc.
IN modern devices The IR spectrum is determined by scanning the phase shift between two parts of a divided light beam (Fourier spectrometry). This method offers significant gains in photometric and wavelength accuracy.
Fourier spectrometers are significantly superior to diffraction instruments in photometric accuracy. In diffraction devices, the receiver receives light only in a narrow spectral range, which falls on the output slit of the monochromator. In Fourier spectrometers, the photodetector always receives all the light from the source, and all spectral lines are recorded simultaneously. Consequently, the signal-to-noise ratio increases.
The IR spectroscopy method is based on the extraction of petroleum products from a sample with carbon tetrachloride or freon 113, purification of the extract from polar compounds by column chromatography on aluminum oxide and subsequent registration of radiation absorption in the spectral region of 2700-3200 cm-1, caused by stretching vibrations of CH3 and CH2 groups of aliphatic and alicyclic compounds and aromatic hydrocarbon side chains, as well as CH bonds of aromatic compounds.
The method can be implemented either in the variant of recording the absorption spectrum in the specified region using a traditional or Fourier spectrometer, or in a simpler version, in which an analyzer is used that measures the integral absorption of radiation in the region of 2900-3000 cm-1, in which the most intense absorption bands corresponding to asymmetric stretching vibrations of the CH3 and CH2 groups.
The method requires mandatory calibration of the measuring instrument using standard samples of the composition of a solution of petroleum products in carbon tetrachloride. In Russia, standard samples are used, prepared on the basis of the so-called three-component mixture (37.5% hexadecane, 37.5% 2,2,4-trimethylpentane and 25% benzene by weight). The lower limit of the measurement range is 0.05 mg/dm3. The main advantage of the method is the weak dependence of the analytical signal on the type of petroleum product that forms the basis of sample contamination.
Difficulties that arise when using the method are associated with the interfering influences of lipids and other polar compounds when their content is high, at which the capacity of the chromatographic column used to purify the extract is exhausted. The main disadvantage of the method is that it is not environmentally friendly due to the highly toxic solvents used.
Qualitative indicators of oil from Samara fields, their correspondence to commercial oil
The Institute of Petroleum of the SB RAS carried out a comparative analysis of the quality of Russian oil and assessed the main oil and gas fields, including the Volga-Urals. Russia's development strategy in the energy sector provides for an increase in oil refining volumes to 220-225 million tons per year. A significant part of the obtained petroleum products is planned to be exported, including to Western Europe. However, the constant tightening of environmental and quality requirements European Union to consumed petroleum products may lead to a reduction in the export capabilities of the Russian oil refining industry. Because of this, the task of ensuring world-class quality of products is becoming increasingly urgent for domestic refineries. The complexity of its solution is largely determined by the quality of the raw materials supplied for processing. Consequently, determining the quality of oil produced from various fields becomes important for both producers and consumers of oil.
For crude oil, the main qualitative characteristics are density, sulfur content and fractional composition. In TU 39-1623-93 “Russian oil supplied for export” according to the listed physical and chemical properties oil is divided into four types (see table 1).
Table 1. Classification of oil supplied for export
Determination of oil quality
Abroad, when determining oil quality indicators, density and distillation quality models are used.
In the density model, the quality of oil and, accordingly, its cost indicators are associated with density and sulfur content. The distillation model connects the quality of oil and its cost with the potential of light fractions of oil. An attempt to bring the quality of domestic oil to world standards led to the fact that in 1989 in our country, for the first time, in additions to GOST 9965 “Oil for oil refineries. Specifications» Density and mass sulfur content were proposed as the main indicators characterizing the consumer properties of oil. Later, the following physical and chemical properties of oil are indicated as the most significantly influencing the consumer properties of oil:
· oil density p;
· yield of fractions at temperatures up to 200, 300 and 350 degrees;
· mass fraction of sulfur S;
· concentration of chloride salts C.
The density of oil largely depends on the amount of asphalt-resinous substances it contains, which contribute to the formation of persistent water-oil emulsions, increasing the cost of its processing. Others are being identified Negative consequences when processing heavy tarry oils. In particular, an increase in costs during transportation and processing of such oil. Increased content sulfur in oil leads to intense corrosion of equipment, the need for alkalization of refined products, hydrotreating of gasoline fractions, and “poisoning” of catalysts. But an increase in the content of light fractions, leading to a reduction in costs in the production of fuels, improves the quality of oil. The concentration of chloride salts reflects oil contamination during the development of the deposit, during the production process.
A complex quality indicator K is defined for assessing commercial oil. Since there is no similar comprehensive criterion for determining the quality of oils in deposits of different fields and oil and gas provinces (OGP), an attempt was made to use the K indicator. technological indicator C is taken equal to 100 mg/l. The methodology for determining the complex oil quality indicator K considered in this article involves calculation using the formula:
K = 0.04S + 0.00054C + 1.74p-0.0087F 200 -0.0056F 300 -0.0049F 350 , (1)
C - concentration of chloride salts (mg/l),
p - oil density (g/cm3),
F 200, F 300, F 350 - content of fractions at temperatures up to 200, 300 and 350 °C, respectively (% volume).
TO at = 0.0029S + 0.00039C + 2.696s- 1,003 , (3)
An upward deviation of the complex quality indicator obtained from equation (1) from unity means a deterioration in the quality of oil (increasing the cost of its refining), and a downward deviation means an improvement in the quality of oil (cheaper refining). Therefore, the criterion for classifying oil according to a comprehensive quality indicator is as follows:
If K< 1 - нефть высокого качества;
At K? 1 - low quality oil.
A comprehensive quality indicator and its simplified meaning.
Calculations of the values of quality indicators K and K y were made using equations (1) and (3), where the values of the parameters p, S, Ф 200, Ф 300 are basin average values in volumetric units. In this case, in (1) we will take the value C = 100 mg/l, and F 350 is approximately calculated from expression (2).
The average values for K and K y are 0.978 and 0.938, respectively. Those. calculation according to formula (3) gives a shift in values compared to calculation according to (1) in the direction of decreasing quality indicator values, which corresponds to an increase in oil quality. Confidence interval limits
K = 0.978 ± 0.090
for the average value of K with a confidence probability of 0.95, the values range from 0.888 to 1.068. Consequently, the average value of the K y indicator, equal to 0.938, is within the boundaries of the confidence interval (0.888 - 1.068) for the average value of K, calculated using the same formula (1).
The relationship between the quality and price of oil.
Let us consider how calculations according to (1) and (3) affect the determination of the price of oil, taking into account the fact that the quality of oil is extremely important for its cost. In world practice, the difference in oil prices is determined by the potential content of light petroleum products, and the quality is assessed by its density and sulfur content. Analyzing the formulas for calculating the oil quality indicator, we can conclude that the quality, and, consequently, the price of oil, is more influenced by its density indicator than by the sulfur content, since the coefficient of mutual significance of density c in formula (1) is the largest in terms of compared to other coefficients. Therefore, below we will consider the impact of changes in oil density on the oil price forecast.
The paper proposes a method for calculating the coefficients of the influence of density on the price of oil. Thus, for the Russian export mixture Urals the coefficient linear dependence prices depending on density is equal to $0.23 per ton of oil when density changes by 0.001. The average value of K according to (1) corresponds to the average density value p equal to 0.856. Taking in (3) the value of K y equal to the average value of K = 0.978, we find the apparent value of density p y, which differs from c by?p = 0.039. Consequently, an increase in oil density by 0.039 will entail a decrease in the price of a ton of Urals by $8.97, if the quality is calculated using formula (3).
Similar studies were carried out for other oils. For American WTI oil, the linear dependence coefficient is equal to $0.47 per ton with a change in density by 0.001, and for oil from the American company Conoco, the change in oil price is equal to $0.22 per ton with a change in density by 0.001. Therefore, an increase in density by 0.039 for such oil means a decrease in its price by $8.58 per ton when using formula (3) to calculate the quality of oil.
Comparison of oils of the main petroleum products by quality and physical and chemical properties
IN table 2 The distribution of petroleum products across the territory of the CIS countries is presented, taking into account the quality indicator K, calculated for the oils of each province using formula (1) and averaged over the entire territory of the provinces.
Table 2. Distribution of NGP by quality indicator
|
Province name |
Average K |
Interval of change K |
Number of records in the database |
|
Okhotsk |
|||
|
Baltic |
|||
|
Dnieper-Pripyatskaya |
|||
|
North Caucasian |
|||
|
Timan-Pechorskaya |
|||
|
Leno-Tungusskaya |
|||
|
West Siberian |
|||
|
Volgo-Ural |
|||
|
Caspian |
|||
|
Leno-Vilyuiskaya |
|||
|
Yeniseisko-Anabar |
It can be seen that most Russian oil and gas reserves contain high quality oils (K< 1), за исключением Лено-Вилюйской и Енисейско-Анабарской НГП (К >1). We see that the Volga-Ural province has K< 1. Следовательно, в самарском регионе мы имеем нефти высокого качества.
It is also interesting to compare the main petroleum petroleum products of Russia in terms of the physical and chemical properties of oils based on the classification presented in table 2. To do this, we will introduce an additional 5th type of oil, which does not correspond to any of the 4 types presented in table 1. This 5th type has the following characteristics:
p > 895 kg/m3,
F 200< 19%,
F 300< 35%,
F 350< 48%.
The distribution of oils from the main Volga-Ural oil and gas fields according to parameters p, S, Ф 200 and Ф 300 is presented in table 3.
Zoning of the territory of the Volga-Ural province according to oil quality
The Volga-Ural oil and gas pipeline is one of the oldest and still the main oil-producing provinces of Russia. It is characterized high degree exploration and depletion of hydrocarbon reserves. Geofencing of the territory of the Volga-Ural oil and gas province according to the complex oil quality indicator K was carried out using a data array of 1983 oil samples (Table 1) more than 500 VUNGP deposits. To carry out the analysis, the average values (over the territory of the fields) for the values of p, S, Ф 200 and Ф 300 were determined.
Most deposits (more than 62% of total number VUNGP fields with known oil quality) contain high quality oil. The largest of them are: in the Samara region - Kuleshevskoye, Mukhanovskoye, Rassvetskoye;
Table 3. Distribution of petroleum gas oils by 5 types
|
Oil type |
Volgo - Ural |
|||||||
|
Classification of oils by density (%) |
||||||||
|
Classification of oils by sulfur content (%) |
||||||||
|
Classification of oils according to the yield of fraction F 200 (%) |
||||||||
|
Classification of petroleum petroleum products according to the yield of fraction F 300 (%) |
||||||||
The amount of type 1 oils in terms of sulfur content is the smallest in the Volga-Ural oil and gas province (about 14%). Type 1 oils based on the yield of the F 200 fraction are the least abundant in the Volga-Ural oil and gas province (more than 48% of all oils in the province).
It should be noted that fields with high-quality oil are available throughout the entire territory of VUNGP, but on the outskirts of the province they make up the absolute majority. On rice. 1 The general distribution of oils of the Volga-Ural oil and gas province by quality is presented. It can be seen that about 2/3 of all oils in the Ural-Volga region have high quality, and the remaining 1/3 refers to low quality oils.


Src="https://present5.com/presentation/3/174642540_451406648.pdf-img/174642540_451406648.pdf-1.jpg" alt=">Fractional composition of oil">!}
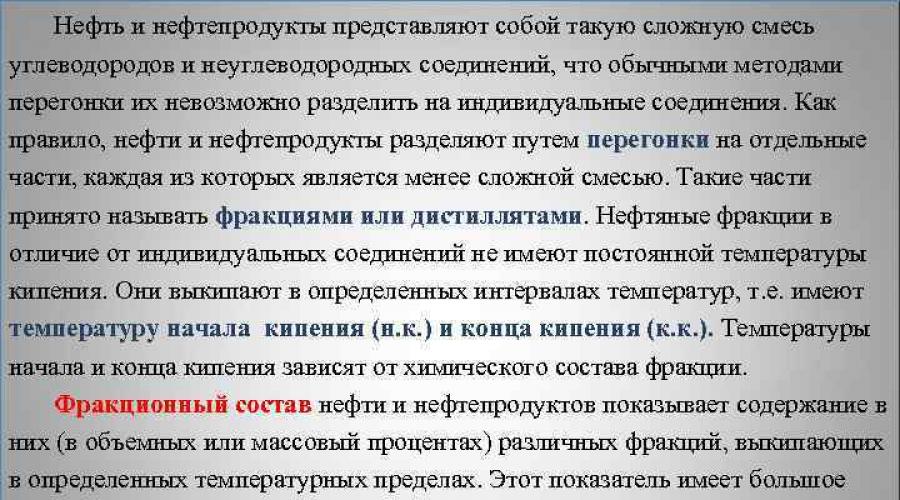
Src="https://present5.com/presentation/3/174642540_451406648.pdf-img/174642540_451406648.pdf-3.jpg" alt="> Oil and petroleum products are such a complex mixture of hydrocarbons and non-hydrocarbon compounds,"> Нефть и нефтепродукты представляют собой такую сложную смесь углеводородов и неуглеводородных соединений, что обычными методами перегонки их невозможно разделить на индивидуальные соединения. Как правило, нефти и нефтепродукты разделяют путем перегонки на отдельные части, каждая из которых является менее сложной смесью. Такие части принято называть фракциями или дистиллятами. Нефтяные фракции в отличие от индивидуальных соединений не имеют постоянной температуры кипения. Они выкипают в определенных интервалах температур, т. е. имеют температуру начала кипения (н. к.) и конца кипения (к. к.). Температуры начала и конца кипения зависят от !} chemical composition factions. The fractional composition of oil and petroleum products shows the content in them (in volume or mass percentage) of various fractions that boil off in certain temperature limits. This indicator is of great practical importance. The fractional composition of oil is used to determine which petroleum products and in what quantities can be isolated from it, and the fractional composition of gasoline and other motor fuels characterizes their volatility, completeness of evaporation, etc.
Src="https://present5.com/presentation/3/174642540_451406648.pdf-img/174642540_451406648.pdf-4.jpg" alt="> The main fractions isolated from oil in industrial plants: 1."> Основные фракции, выделяемые из нефти на промышленных установках: 1. Бензиновая н. к. (28˚С) – 180 ˚С (без отбора керосиновой фракции) или н. к. (28 ˚С) – 150 ˚С (без отбора керосиновой фракции); 2. Керосиновая 150 ˚С – 250 ˚С; 3. Дизельная (180 ˚С) – 350 ˚С (без отбора керосиновой фракции) или 250 ˚С – 350 ˚С (с отбором керосиновой фракции). В ряде случаев отбирают дизельную фракцию утяжеленного состава с концом кипения 360 ˚С. Суммарный выход этих фракций (до 360 ˚С) составляет количество светлых фракций нефти. Из остатка мазута получают: 4. Вакуумный газойль 350 ˚С (360 ˚С)- 500 ˚С(550 ˚С); 5. Гудрон >500 ˚С (> 550 ˚С) – самый тяжелый продукт перегонки нефти.!}
Src="https://present5.com/presentation/3/174642540_451406648.pdf-img/174642540_451406648.pdf-5.jpg" alt="> Distillation (distillation) is the process of separating complex mixtures of hydrocarbons by partial evaporation liquid or"> Дистилляция (перегонка) – процесс разделения сложных смесей углеводородов путем частичного испарения жидкости или частичной конденсацией паровой смеси с образованием двух фаз (перегонка), из которых паровая обогащается низкокипящим компонентом (нкк), а жидкая – высококипящим (вкк) по сравнению с исходной смесью. Лабораторная установка для перегонки нефти!}
Src="https://present5.com/presentation/3/174642540_451406648.pdf-img/174642540_451406648.pdf-8.jpg" alt="> Laboratory equipment for oil distillation ARN-2">!}
Src="https://present5.com/presentation/3/174642540_451406648.pdf-img/174642540_451406648.pdf-9.jpg" alt="> ARN-LAB-11 Automatic apparatus for determining the fractional composition of oil and petroleum products">!}
Src="https://present5.com/presentation/3/174642540_451406648.pdf-img/174642540_451406648.pdf-10.jpg" alt="> Distillation of oil and petroleum products for the purpose of separation into fractions can be carried out with"> Перегонку нефти и нефтепродуктов с целью разделения на фракции можно осуществить с постепенным либо с однократным испарением. При перегонке с постепенным испарением образующиеся пары непрерывно отводят из перегонного аппарат, они конденсируются и охлаждаются в конденсаторе-холодильнике и собираются в приемник в виде жидких фракций. В том случае, когда образующиеся в процессе нагрева пары не выводятся из перегонного аппарата до тех пор, пока не будет достигнута заданная температура, при которой в один прием (однократно) отделяют паровою фазу от жидкой, процесс называют перегонкой с однократным испарением. После этого строят кривую ОИ (см. рис.) Данные способы перегонки не позволяют добиться четкого разделения нефтепродуктов на узкие фракции, т. к. часть высококипящих компонентов переходит в дистиллят, а часть низкокипящих фракций остается в жидкой фазе. Поэтому применяют перегонку с дефлегмацией или ректификацией. Для этого в колбе нагревают нефть или нефтепродукт; образующиеся при перегонке пары, почти лишенные высококипящих компонентов, охлаждаются в специальном аппарате – дефлегматоре и переходят в !} liquid state- phlegm. Phlegm, flowing down, meets the newly formed vapors. As a result of heat exchange, low-boiling components evaporate, and high-boiling components of the vapor condense. With this contact of vapors, a clearer separation into fractions is achieved than without reflux.
Src="https://present5.com/presentation/3/174642540_451406648.pdf-img/174642540_451406648.pdf-11.jpg" alt=">1 – curve obtained by distillation with clear rectification (ITC curve) ; 2 – curve"> 1 – кривая, полученная перегонкой с четкой ректификацией (кривая ИТК); 2 – кривая однократного испарения (кривая ОИ); 3 – кривая, полученная простой перегонкой (разгонка по Энглеру) ; t 1, t 2, t 3, …tn – температуры кипения при оборе дистиллята в точках x 1, x 2, x 3, …xn. ; Фракция t 1 -t 2 выкипает в количестве x 2 -x 1, е – массовая доля отгона!}
Src="https://present5.com/presentation/3/174642540_451406648.pdf-img/174642540_451406648.pdf-12.jpg" alt="> Distillation apparatus with reflux condenser">!}
Src="https://present5.com/presentation/3/174642540_451406648.pdf-img/174642540_451406648.pdf-13.jpg" alt=">An even clearer separation occurs during distillation with rectification. An apparatus for such distillation"> Еще более четкое разделение происходит при перегонке с ректификацией. Аппарат для такой перегонки состоит из перегонной колбы, ректификационной колонки, конденсатора холодильника и приемника.!}
Src="https://present5.com/presentation/3/174642540_451406648.pdf-img/174642540_451406648.pdf-16.jpg" alt="> Most widespread in laboratory practice received the following types distillation: "> The following types of distillation are most widespread in laboratory practice: 1. Distillation based on the principle of gradual evaporation: – simple distillation of oil and petroleum products boiling up to 350 ˚С at atmospheric pressure; – simple distillation of petroleum products boiling above 350 ˚С under reduced pressure (under vacuum); – distillation with reflux; – distillation with precise rectification. 2. Distillation based on the principle of single evaporation: – distillation with single evaporation. 3. Molecular distillation for high molecular weight compounds and resins.
Src="https://present5.com/presentation/3/174642540_451406648.pdf-img/174642540_451406648.pdf-17.jpg" alt="> Vacuum distillation is one of the methods for separating mixtures organic matter. Widely used"> Vacuum distillation is one of the methods for separating mixtures of organic substances. It is widely used in situations where distillation cannot be carried out at atmospheric pressure due to the high boiling point of the target substance, which leads to thermal decomposition of the distilled product. Since the liquid is in a vacuum boils at a lower temperature, it becomes possible to disperse liquids that decompose during distillation at atmospheric pressure.
Src="https://present5.com/presentation/3/174642540_451406648.pdf-img/174642540_451406648.pdf-19.jpg" alt="> Molecular distillation, unlike conventional distillation, is not associated with"> Молекулярная дистилляция в отличие от обычной дистилляции не связана с кипением раствора, а протекает в условиях испарения со свободной поверхности. Она может быть применена для жидкостей, которые не выдерживают !} high temperatures and cannot be brought to a boil without danger of decomposition. Molecular distillation is used to separate and study high molecular weight substances contained in petroleum residues obtained by conventional distillation. This method is used to distill thermally unstable substances from molecular weight 250 - 1200, vacuum oils, high-viscosity oils with a high viscosity index are obtained.
Src="https://present5.com/presentation/3/174642540_451406648.pdf-img/174642540_451406648.pdf-20.jpg" alt=">Industrial molecular distillation plants">!}
Src="https://present5.com/presentation/3/174642540_451406648.pdf-img/174642540_451406648.pdf-21.jpg" alt="> Simulated distillation. For the analysis of petroleum products, a widely used gas chromatographic"> Имитированная перегонка. Для анализа нефтепродуктов используется широко распространенный газохроматографический метод имитированной дистилляции. Традиционный метод имитированной дистилляции предполагает использование насадочных колонок. Спецификация на реактивное топливо и дизельное топливо указывает имитированную дистилляцию как альтернативу дистилляции при атмосферном давлении при получении информации об истинном распределении по температурам кипения. Метод имитированной дистилляции использует газохроматографическую технику для получения информации об истинном распределении по температурам кипения нефти и нефтяных фракций до 750 °С.!}
Src="https://present5.com/presentation/3/174642540_451406648.pdf-img/174642540_451406648.pdf-22.jpg" alt="> Simulated distillation. Using the simulated distillation method, a true boiling point curve is obtained, which"> Имитированная перегонка. Методом имитированной дистилляции получают кривую истинных температур кипения, которая строится по данным хроматографического разделения исследуемого продукта на колонке с неполярным сорбентом в режиме программирования температуры. После ввода образца в инжектор, группы углеводородов выводятся на хроматограмму в порядке возрастания их температур кипения. Предварительно выполняется калибровка системы по эталонной смеси углеводородов с известными температурами кипения. Кривые имитированной дистилляции хорошо совпадают с результатами определения фракционного состава перегонкой при атмосферном давлении и при пониженном давлении. Для описания тяжелых фракций нефти использовали газовый хроматограф с высокотемпературным термостатом. Метод имитированной дистилляции с помощью газовой хроматографии позволяет проводить анализ нефтяных продуктов не только быстрее и с большей степенью точности, но и требует для осуществления меньшего количества анализируемых веществ.!}